
Almost every search for free NinjaTrader indicators starts from the same assumption: that the platform is a blank chart and everything useful has to be added to it. That was true of NinjaTrader 7. It has not been true of NinjaTrader 8 for years, and it is worth spending ten minutes on what is already installed before spending an evening on downloads.
What follows is what the platform includes, what those tools can and cannot do, and where the honest limit is.
What NinjaTrader 8 includes at no extra cost
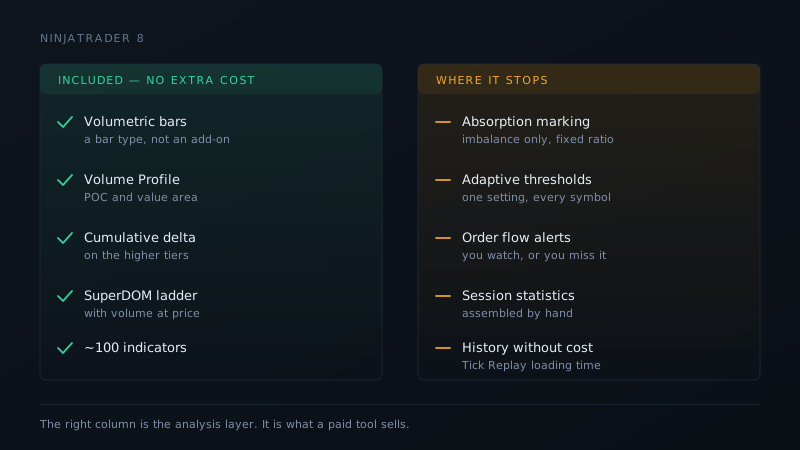
Volumetric bars. A bar type, not an indicator — you set it on the chart itself. It draws volume at each price inside the bar with a bid/ask split, which is the thing usually sold as a footprint chart. It marks buying and selling imbalance against a ratio you choose, and it prints delta per bar.
A volume profile. The Volume Profile indicator draws volume by price over a session or a fixed range, with the point of control and a value area. It is a real profile, not an approximation of one.
Order flow tools on the higher licence tiers. Cumulative delta, a trade detector and the SuperDOM ladder with volume are part of the platform rather than third-party additions. Which of them you have depends on your licence, and that is worth checking before buying anything — people regularly pay for a tool that duplicates one they already own.
Market Analyzer and the standard indicator library. Around a hundred classical indicators ship with the platform, and Market Analyzer will scan a watchlist on any of them.
Where the built-in tools stop
The built-in volumetric bar shows you the data. What it does not do is much of the interpretation on top of it:
Absorption and exhaustion are not marked. Imbalance is, against a fixed ratio. Absorption — heavy volume at a price that then fails to move — is visible if you are looking at the right bar at the right moment, and is not flagged.
The thresholds do not adapt. An imbalance ratio calibrated for one instrument is usually wrong for another, and there is nothing that adjusts it for you or tells you it has drifted.
There is no alerting on order flow conditions. You watch, or you miss it. On a fast instrument that is a real constraint rather than a convenience one.
Session statistics have to be assembled by hand. Comparing today's profile shape against the last twenty sessions is possible and it is manual.
Historical bars need Tick Replay. The bid/ask split has to be reconstructed from the trade stream, so any historical footprint costs loading time in proportion to how much history you ask for.
Where free NinjaTrader indicators actually come from
There is a genuine ecosystem of shared NinjaTrader code, and some of it is good. Three things are worth knowing before you install any of it.
Most shared indicators are reimplementations of something already in the platform — a second volume profile, a delta display, a moving-average variant. If the built-in version does the job, the download is a maintenance liability with no gain.
An indicator is compiled code that runs inside your platform, with whatever access the platform has. That is a reasonable thing to accept from a source you can identify and an unreasonable one to accept from a forum attachment with no name on it.
And free code is maintained until it is not. NinjaTrader's own updates break add-ons periodically. A tool nobody is being paid to maintain gets fixed when its author feels like it, which may be never, and you find out mid-session.
What we give away, and what we do not
We should be direct about this, because the search that brought you here deserves a straight answer: we do not publish free NinjaTrader indicators. We build paid ones.
What we do publish for free, with no account and no e-mail address, is the teaching. Our education section holds twenty-four written lessons on volume and order flow analysis — how a profile is read, what delta divergence is worth, how to size a stop against structure. They are complete lessons rather than a preview of something else, and they stay that way.
If you want to know what a paid tool adds on top of the volumetric bar, the two pages worth reading are footprint charts and how to read them and how NinjaTrader volume indicators work in practice. Both describe the method rather than the product, and both say where the built-in tools are sufficient.
The short version
Open a chart, set the bar type to Volumetric, add the Volume Profile indicator, and trade with those for a month. You will learn more about whether you need anything else than any amount of reading will tell you — and a good deal of what is sold as an order flow package is a more comfortable version of what you just switched on.
If, after that month, you find yourself squinting at bars trying to spot absorption that nothing marks for you, that is the point at which a paid tool starts to be worth its price. Not before.