📩 You will receive your license key within 24 business hours (usually 2–3 hours) by email.
£350
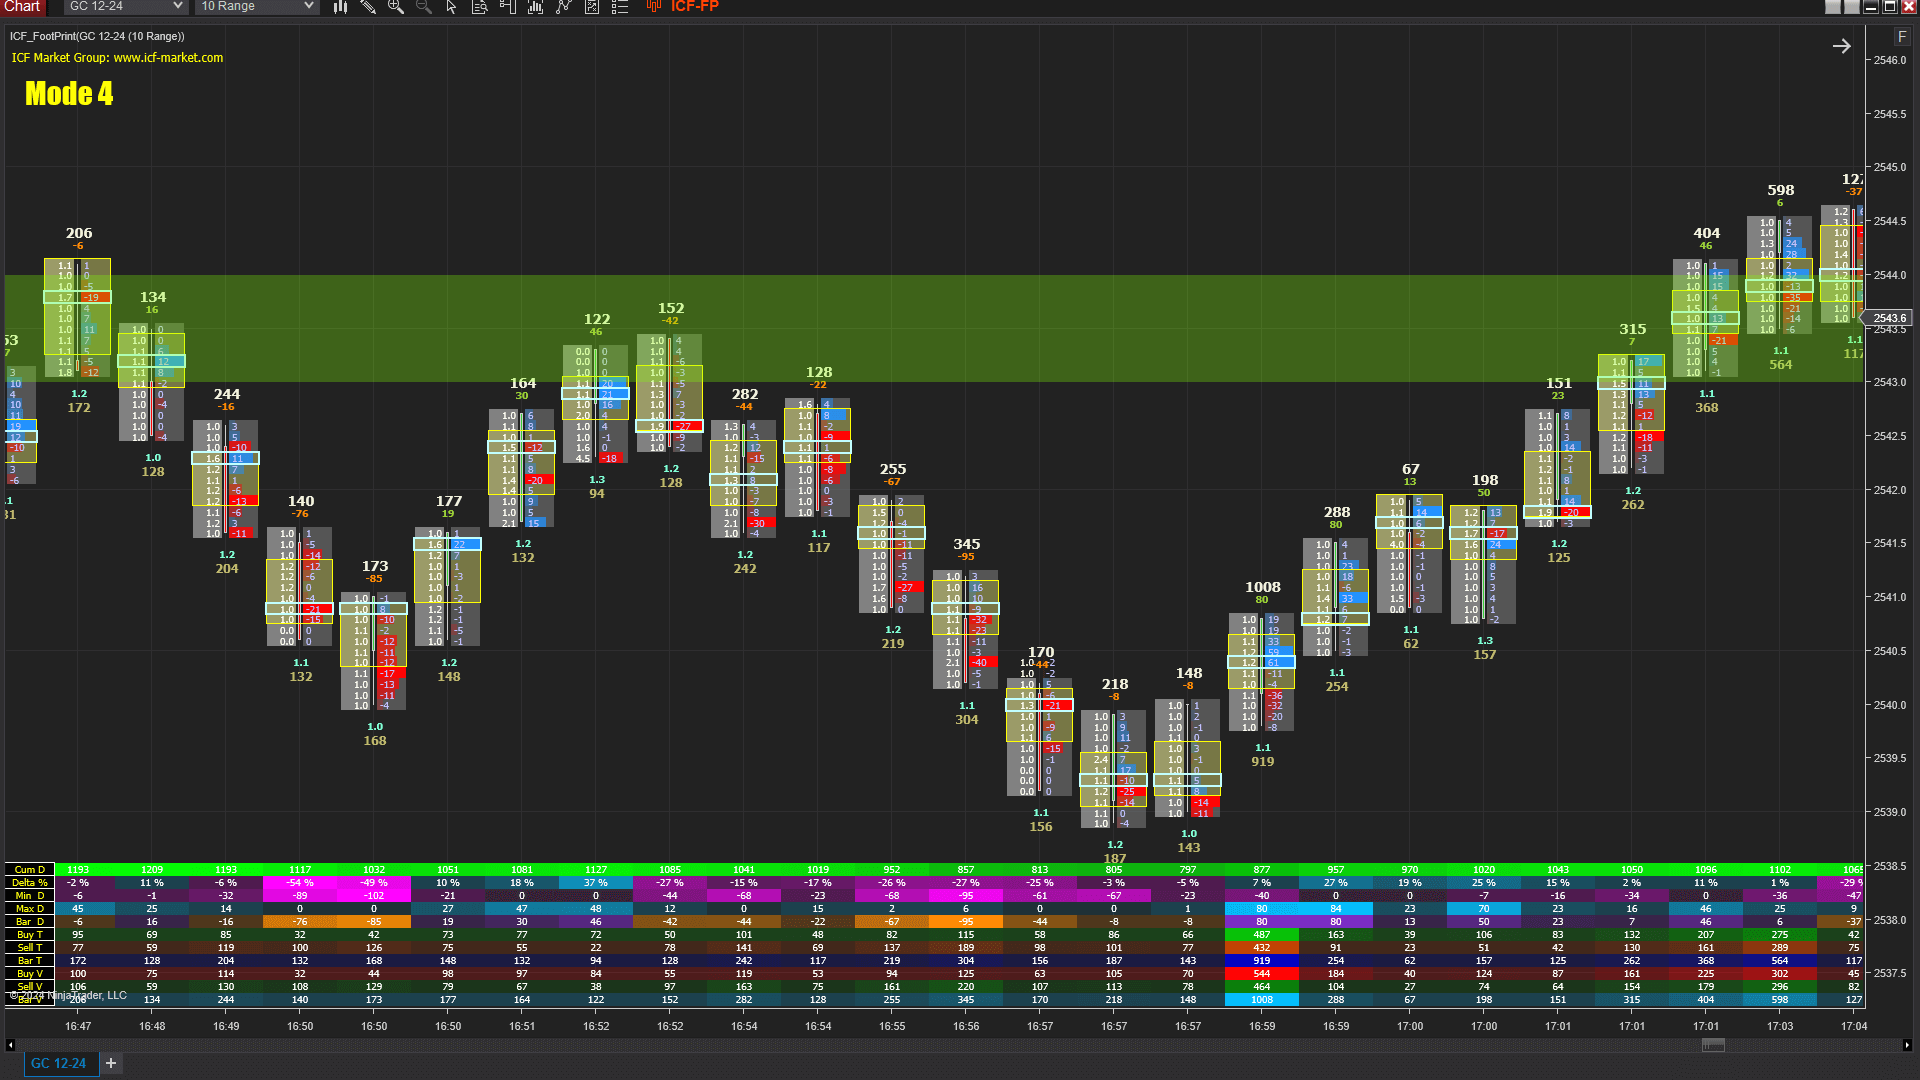
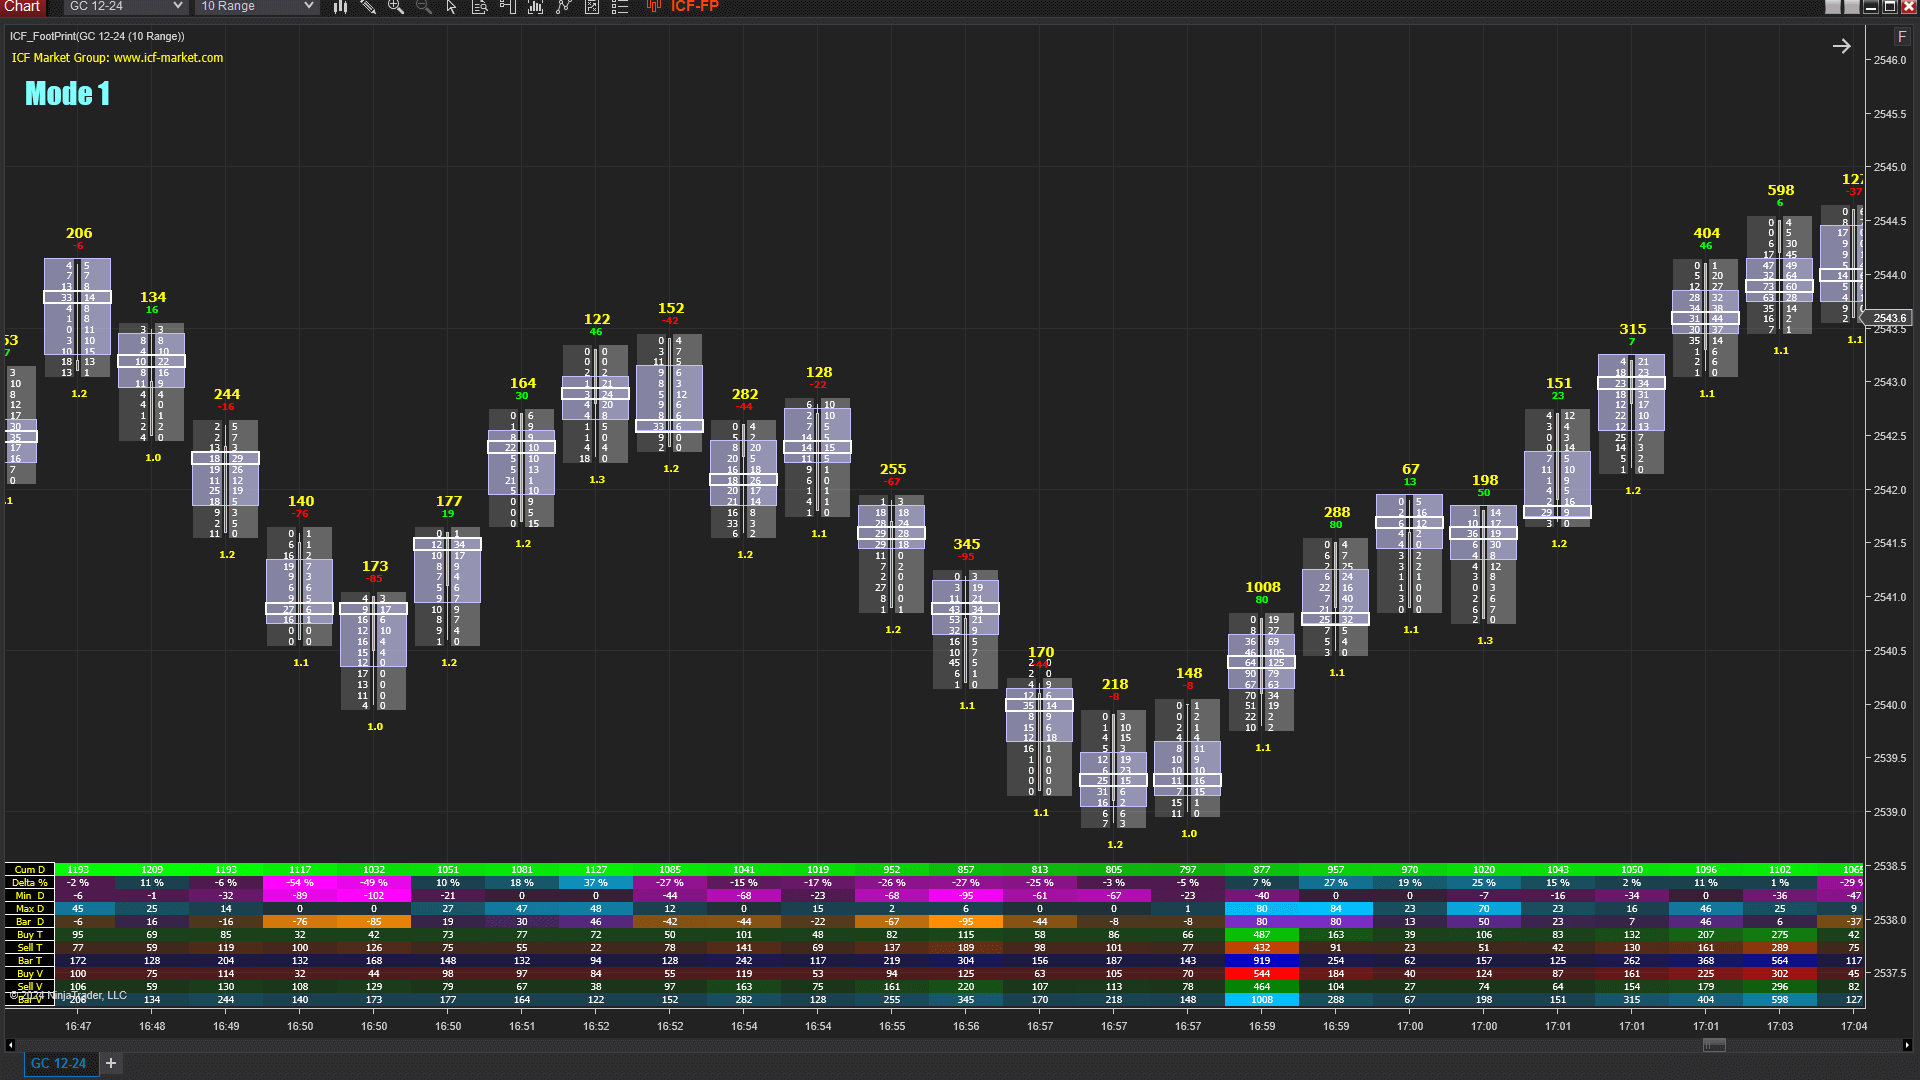
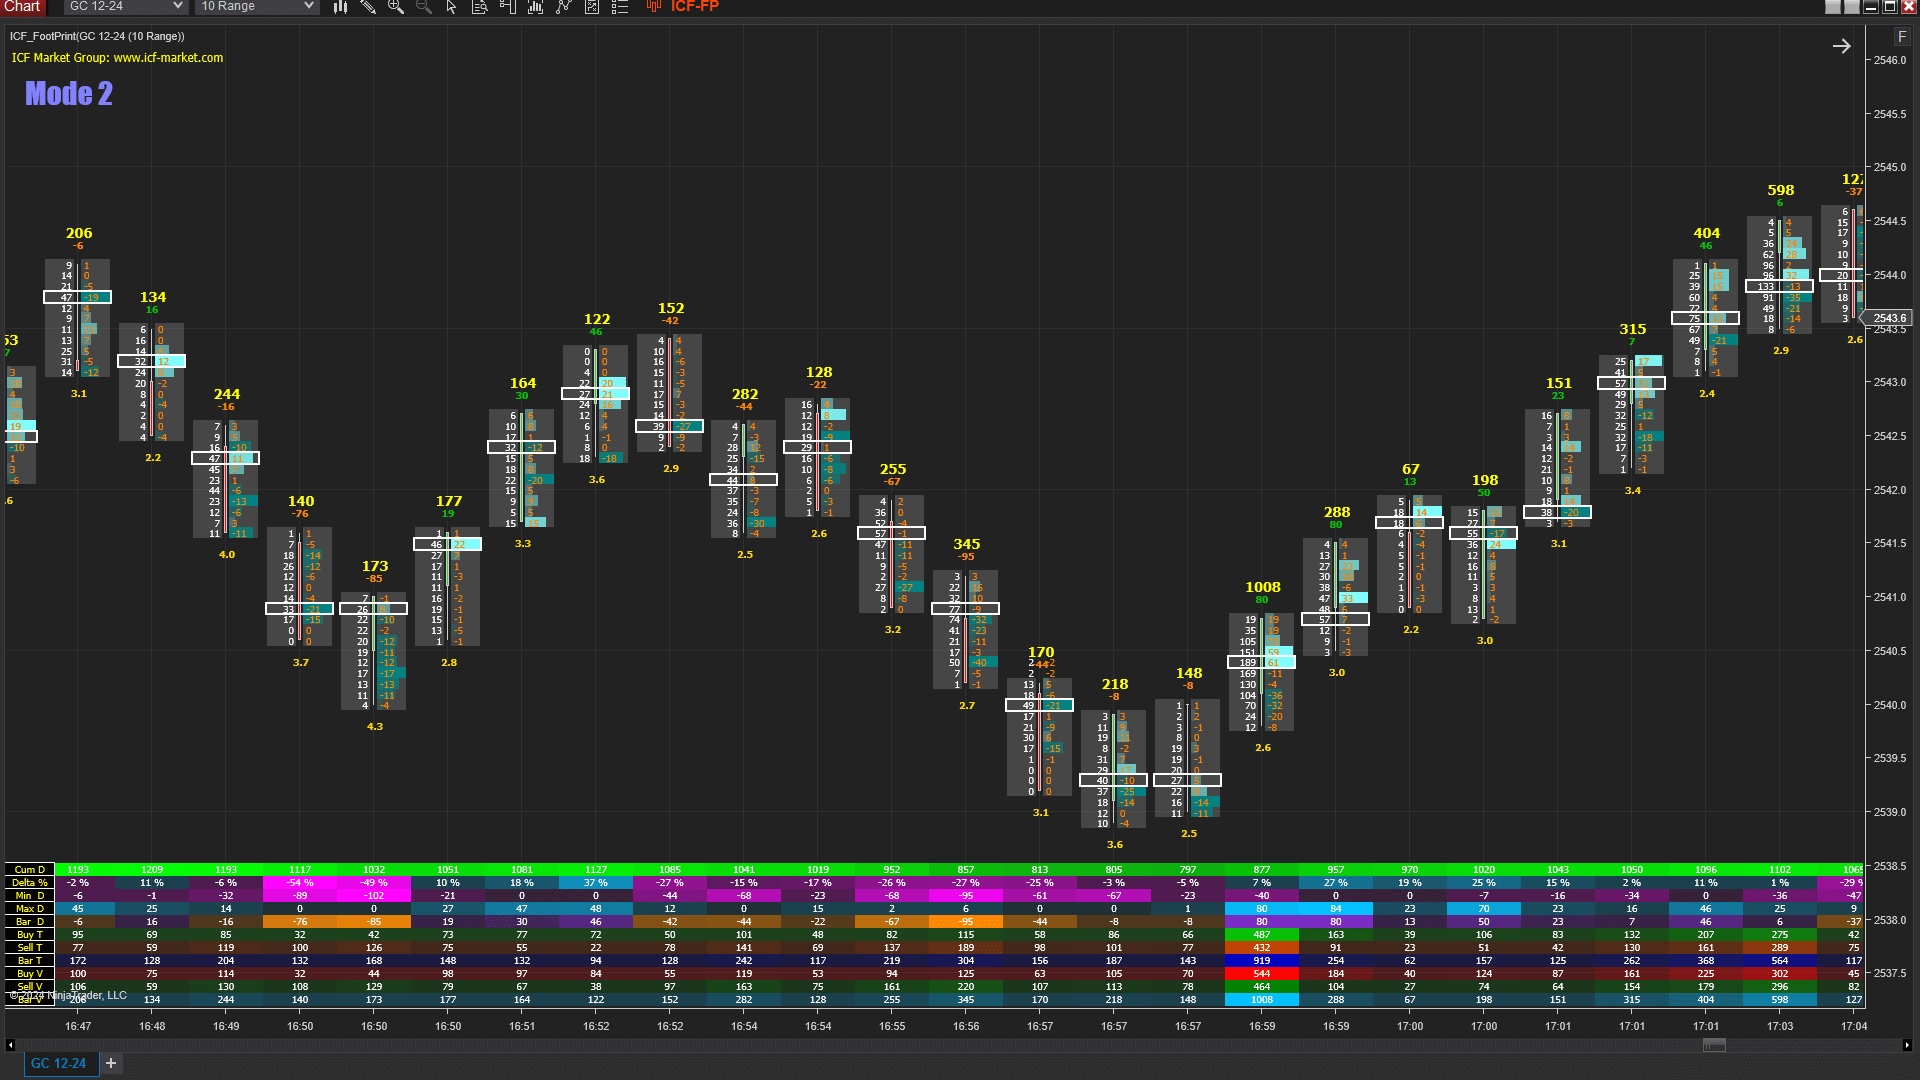
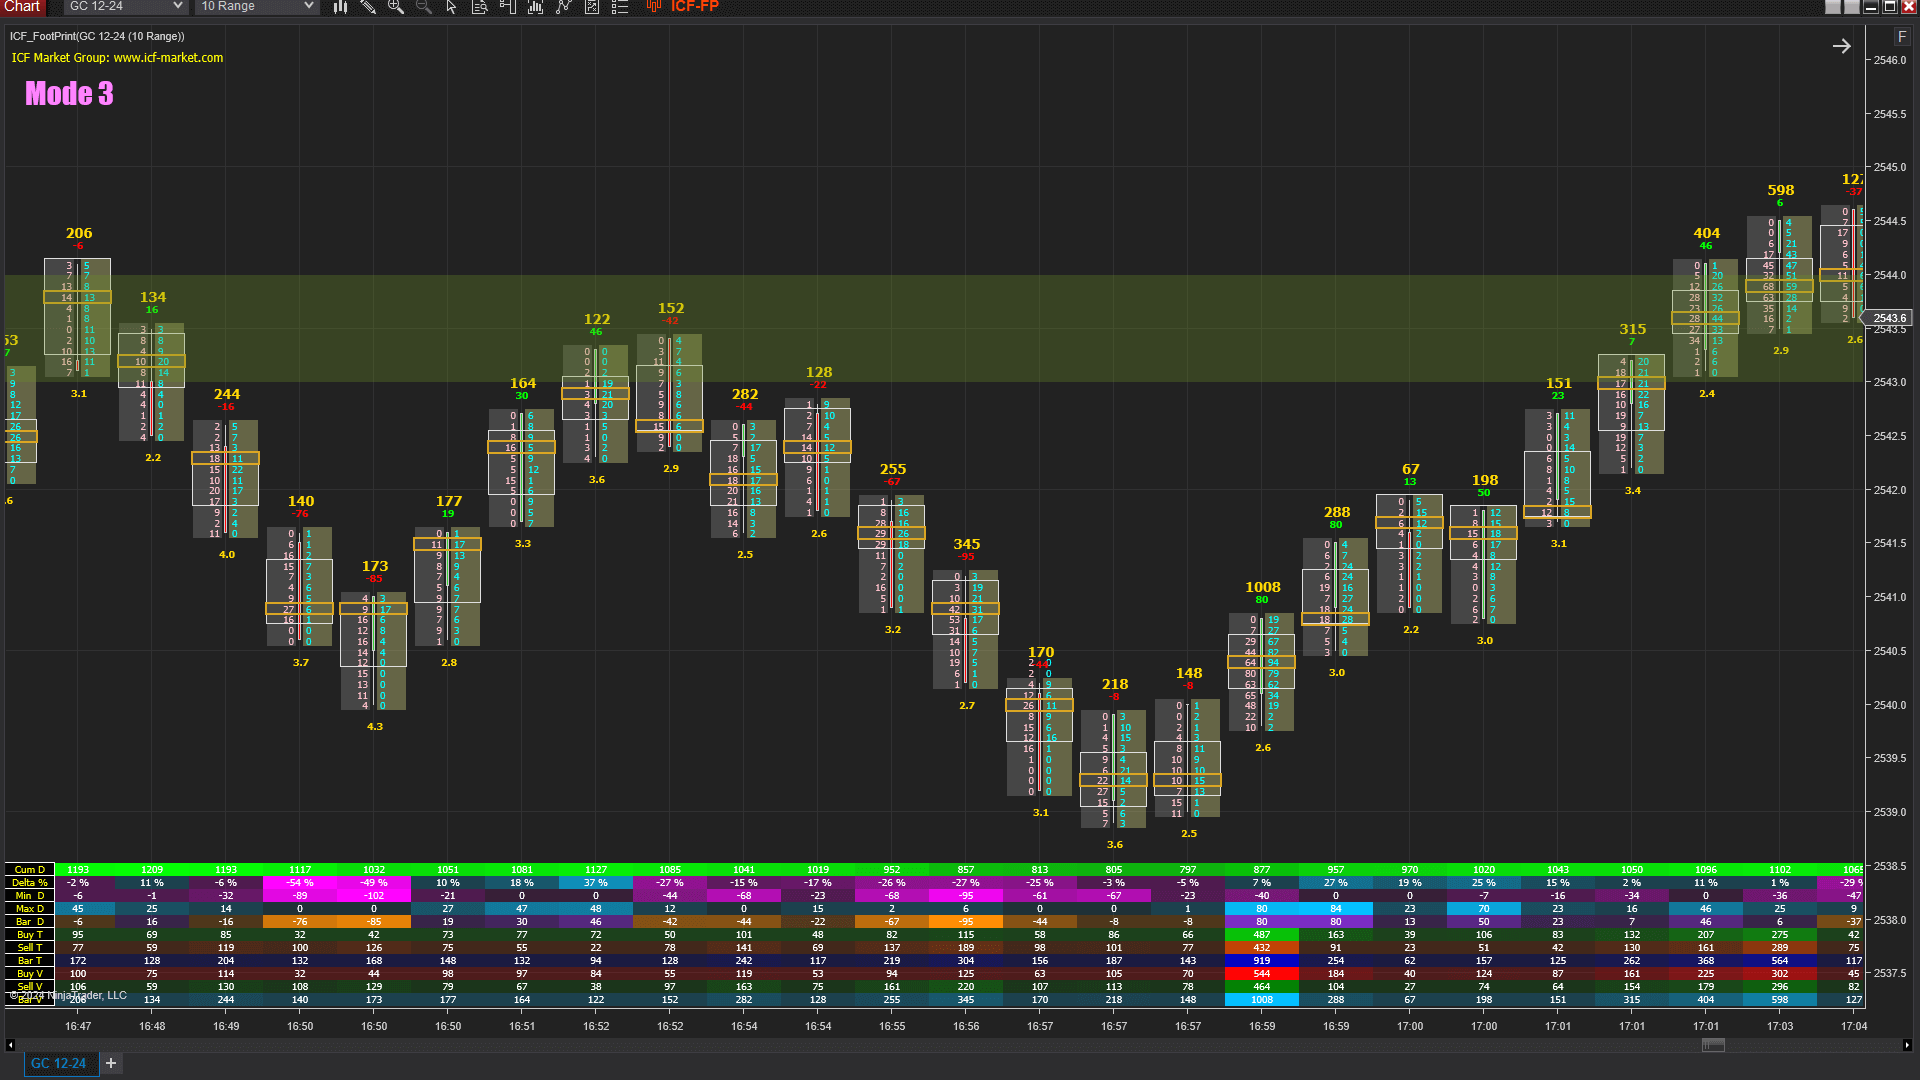
Revolutionary 4-Mode Architecture: One Indicator, Four Strategic Environments
Stop settling for a “one-size-fits-all” view that clutters your workspace. The ICF NinjaTrader Footprint Pro features a unique Quad-Mode System that allows you to toggle between four entirely different visualization strategies instantly—without ever reloading your charts.
This multi-strategy architecture is designed to reduce cognitive load, allowing you to adapt to changing market conditions in real-time. Whether you are hunting for micro-scalps or analyzing long-term institutional absorption, this is the most versatile footprint chart tool for NinjaTrader available today
Deep Dive: The Four Professional Display Modes
Each mode is fully independent, allowing you to pre-configure specific colors, ratios, and filters for different trading objectives:
Mode 1: The X-Ray View (Scalping Precision) Engineered for high-definition Bid/Ask execution. This mode provides a clean view focusing exclusively on Imbalances and Market Speed, making it the ultimate setup for scalpers who need to see aggressive orders the moment they hit the tape.
Mode 2: Volume Profiling & Reversal Detection Integrates real-time Volume Profile and Delta Profile overlays directly within every bar. It is optimized to highlight Delta Divergence and Absorption, helping you identify high-probability reversal points where the market “runs out of steam”.
Mode 3: Imbalance & Absorption (Trend Analysis) Utilizes color-coded ratio bands and dynamic value-area shading to expose aggressive market participants and liquidity traps. This mode focuses on Unfinished Auctions and market momentum, ensuring you stay on the right side of a trending market.
Mode 4: Institutional Hybrid (The Deep Dive) Our most comprehensive view, combining the best of ICF Market’s proprietary algorithms for fast-moving markets. It provides full detailed numbers and session-wide value areas, revealing exactly where “Smart Money” is absorbing retail orders for a precise institutional-grade entry.
Why “Quad-Mode” is the Ultimate NinjaTrader Footprint Edge?
While other footprint indicator options on the market are resource-heavy or visually static, the ICF Pro is built for high-performance execution.
Seamless Switching: Toggle between your four pre-configured environments directly from the control panel without refreshing data.
Zero-Lag Performance: Optimized for the NT8 multi-threaded architecture to ensure smooth updates even during high-volatility news events.
Total Customization: Each mode features a dedicated filter panel, allowing you to adjust POC thresholds, Delta smoothing, and Automatic Font Scaling independently.
The ICF NinjaTrader Footprint Pro is built on a “Trader-First” philosophy. Unlike static indicators, our interface provides a symmetrical, dual-side settings panel (Left Side & Right Side) for all 4 Modes, giving you total control over how data is processed and displayed. This ensures that your ninjatrader footprint chart adapts to your eyes, not the other way around.
Stop guessing where the big players are trapped. Our advanced algorithms allow you to define exactly what constitutes a market shift:
Smart Imbalance Ratios: Set custom thresholds for Buy/Sell imbalances to highlight aggressive market participants.
Imbalance Volume Filtering: Filter out “noise” by setting a minimum volume requirement before an imbalance is marked.
Automated Imbalance Boxes: Visualize zones of high-conviction institutional interest with stacked imbalance highlighting.
Institutional Absorption Zones: Identify where limit orders are soaking up aggressive market pressure with customizable “Absorption Bar Counts” and volume filters.
Track the “Smart Money” by filtering the tape directly on your footprint chart indicator for NinjaTrader 8:
Bar ATS (Average Trade Size): Instantly spot institutional “Block Trades” by monitoring the average size of trades within each candle.
Bar AVB (Average Volume per Bar): Detect unusual liquidity surges that often precede explosive breakouts.
Point of Control (POC) Multi-Filtering: Use dual POC filters to isolate the most significant price levels and ignore insignificant volume clusters.
Unlock “X-Ray vision” into the auction process with features typically reserved for institutional platforms:
High/Low Price Ratios: Detect exhaustion or unfinished auctions at the extremes of every bar.
Unfinished Auction Alerts: Automatically highlight price levels where the auction process is incomplete, serving as high-probability future targets.
Proprietary “Fishing Rate” Algorithm: A unique ICF feature that tracks “Stop Hunting” behavior. This algorithm identifies where institutional players are “fishing” for retail liquidity before a reversal.
Located at the bottom of every mode, our comprehensive data grid provides a 360-degree view of market sentiment:
Delta Dynamics: Track Cumulative Delta, Delta Percentage, and Min/Max Delta per bar to gauge the true strength of a move.
Volume Breakdown: Monitor Buy vs. Sell volume and trade counts to see who is truly in control of the session.
Dynamic Scaling: Features like Auto Font Scaling and the Built-in Magnifier ensure that even on 4K monitors or in dense, fast-moving markets, your data remains crystal clear.
Every setting you see in the panel—from Delta Profiles to Support/Resistance Bonds—is designed to be toggled on the fly. Because the menus are identical across all modes and sides, you can build a seamless workflow that scales from simple Bid/Ask visualization to a deep institutional deep-dive.


The ICF NinjaTrader Footprint Pro is more than a visualization tool; it is a sophisticated Decision Engine. By integrating a professional-grade signal engine, this ninjatrader footprint chart indicator transforms raw tick data into high-probability buy and sell signals based on real market behavior rather than lagging indicators.
As shown in the “Signal” tab, you can build complex boolean logic for your entries, ensuring that you only trade when your specific high-probability criteria are met.
Institutional Activity Tracking (ATS & AVB): Identify where the “Big Fish” are playing by filtering for Average Trade Size (ATS) to spot block trades and Average Volume per Bar (AVB) to detect abnormal liquidity surges that precede breakouts.
Exposing Market Traps with Delta Logic: Automatically detect Delta Divergence and Convergence to identify when price and delta are out of sync—a classic sign of trend exhaustion or institutional absorption.
Smart POC Positioning: Utilize professional-grade filters like POC in Shadow to identify when the Point of Control is trapped in the wick, signaling a potential price rejection.
Aggressive vs. Passive Dynamics: Filter signals based on the ratio of market orders to limit orders (Aggressive vs. Passive %) to confirm which side is truly dominating the auction.
Once your logic conditions are satisfied, the footprint chart indicator provides immediate visual clarity so you never miss a move.
Configurable Markers: Signals are displayed as user-defined color-coded dots or rectangles, making them instantly visible even in fast-moving markets.
Time-Based Filtering: Specify exact sessions or hours for signal activity to align your strategy with peak market liquidity.
Independent Mode Logic: Configure unique signal parameters for each of your 4 Modes, allowing you to hunt for different setups (such as scalping vs. trend continuation) simultaneously on the same chart


The ICF NinjaTrader Footprint Pro eliminates chart clutter by integrating a powerful, real-time Statistic Grid directly at the bottom of your chart. This feature acts as an institutional data dashboard, providing a 360-degree view of market participation and allowing for fast, data-driven decision-making without taking your eyes off the price action.
Tailor your data dashboard via the General Settings to monitor vital metrics for every bar:
Track Bar Volume Delta, Delta Percentage (%), Max/Min Delta, and Cumulative Delta to understand the relative strength and peak pressure of every move.
Volume & Participation: Monitor Bar Volume, Session Volume, and detailed Buy/Sell Volume to see who is truly in control of the auction.
Trade Count Intelligence: View Bar Trade Counts alongside specific Buy and Sell Trade Counts to identify institutional presence.
At ICF Market, we believe the indicator must adapt to the trader, not the opposite. The General Settings tab provides extensive visual control to ensure clarity during high-volume sessions, such as market opens or major news releases.
Adaptive Visuals for Any Setup: Utilize Auto Font Scale to ensure perfect readability on everything from standard laptops to 4K or ultra-wide monitors.
Independent Mode Configuration: The footprint tool for NinjaTrader allows you to enable the Statistic Grid on specific modes only. You can also choose to keep bar spacing and width independent for each of your 4 Modes, maintaining a clean UI tailored to different strategies like scalping or trend analysis.
Sleek, Professional Aesthetics: Fully customize the background, outline colors, and font settings to fit any dark or light trading environment, eliminating “chart fatigue” during long hours of focused trading.
Zero-Lag Performance: Engineered for the NinjaTrader 8 multi-threaded architecture, the ICF Pro ensures smooth updates and stable behavior even when processing heavy tick data during extreme volatility.
Despite its advanced capabilities, the ICF Footprint Chart Pro remains user-friendly. The interface features intuitive checkboxes and menus, allowing you to toggle features on-the-fly without deep diving into code or restarting your chart. This creates an efficient institutional workflow that bridges the gap between retail price action and professional order flow analysis.

Technical Performance & Advanced Optimization: Built for Professional Stability
The ICF Market NinjaTrader Footprint is engineered for the elite practitioner who demands institutional-grade precision without compromising platform stability. Unlike generic ninjatrader footprint tools that often freeze during high-volatility news events, our engine is specifically optimized for the NinjaTrader 8 multi-threaded architecture to ensure zero-lag performance.
Real-Time “On-Each-Tick” Calculation: The indicator processes every contract traded at every price level in real-time, providing a transparent view of the auction process as it unfolds.
Efficient Data Handling: Optimized to handle heavy tick data processing efficiently, ensuring smooth updates even during the most hectic market conditions without dragging down your platform performance.
Intelligent Loading & Scaling: Features a dedicated “Loading Bar” for seamless data synchronization and “Auto Scale” capabilities to maintain visual integrity across different price ranges.
Take full control over how your ninjatrader footprint chart indicator interacts with historical and live data:
Customizable Look-Back Depth: Adjust the “Maximum bars look back” to balance deep historical analysis with peak system performance.
Tick Replay Compatibility: Fully compatible with NinjaTrader’s Tick Replay, allowing you to review order flow dynamics with tick-by-tick precision for backtesting or post-market analysis.
Granular Price Aggregation: Utilize the “Multiple prices per row” feature to group price levels in highly volatile instruments, simplifying complex patterns into readable signals.
The ICF Pro is designed to be a universal footprint tool for ninjatrader, maintaining stable behavior across all professional chart types:
Support for Range, Tick, and Time Charts: Whether you are a scalper using fast tick charts or a swing trader on daily timeframes, the indicator adapts to your specific workflow.
Precision Visuals: Includes adjustable price markers and scale justification (Left/Right) to ensure your order flow data aligns perfectly with your existing chart setup.

This is one of our signature features. The “Fishing Rate” is designed to detect manipulative order flow behavior—specifically when algorithms are hunting for liquidity (stops) at key levels. It helps you avoid getting “stopped out” right before the move goes your way.
Yes. As seen in the “Mode” settings (Image 4), you have granular control over Sell Imbalance, Buy Imbalance, and Imbalance Volume Filters. You can set specific ratios (e.g., 3:1 or 4:1) and the chart will auto-highlight these zones with your chosen palette.
No. We use efficient rendering methods. The grid calculates data in real-time along with the footprint bars. You can also turn off specific rows in the “General” tab (Image 1) to keep it as lightweight as you need.
This allows you to have different alert rules for different chart modes. You might want aggressive signals when scalping (Mode 1) but conservative signals when trend trading (Mode 3). The ICF Footprint allows you to save independent signal logic for each mode.
Optimized for NinjaTrader 8: Engineered for stability and speed, even during high-volatility news events.
Clean UI/UX: A modern dark-mode aesthetic designed for long hours of focused trading.
Institutional Insight: Move beyond retail indicators and trade based on the actual flow of money.
Don’t trade blindly. Upgrade to ICF NinjaTrader Footprint
Pro and see the market in 4 Dimensions.
Introducing ICF NinjaTrader Footprint Chart Pro
Master Market Microstructure with the Ultimate NinjaTrader Footprint Chart Indicator
Stop trading blind! Traditional candlesticks hide the most critical data: the real-time battle between buyers and sellers. The ICF NinjaTrader Footprint Pro is an elite footprint chart tool for NinjaTrader designed to provide a surgical view of market volume, bid/ask imbalances, and order flow dynamics. By visualizing every contract traded at every price level, this high-performance engine strips away market noise, allowing you to track institutional “Smart Money” with institutional-grade precision.
Standard candles only show where the price went; our footprint chart indicator for NinjaTrader 8 shows you the aggressive orders that drove it there. Designed for elite practitioners of Auction Market Theory, this is the definitive footprint tool for NinjaTrader users who demand to know the “why” behind every price move.
While most footprint indicator options on the market are resource-heavy, lag during high volatility, or appear visually cluttered, the ICF Footprint Pro is engineered for high-performance execution. It transforms raw tick data into a sophisticated visual map of market intent, allowing you to see exactly where institutional “Big Money” is entering or exiting with surgical precision.
Precision Bid/Ask Visualization: See every single contract traded in real-time. This ninjatrader footprint chart indicator provides a completely transparent view of the auction process, exposing the true supply and demand.
Smart Imbalance Detection: Automatically highlight aggressive buying or selling pressure through advanced diagonal and horizontal imbalance algorithms.
Integrated Delta Analysis: Gain a deeper understanding of market sentiment by tracking the net difference between buyers and sellers at every individual price level.
Exhaustion & Absorption Signals: Identify high-probability reversal points by spotting where the market “runs out of steam” (exhaustion) or “hits a wall” of limit orders (absorption).
Custom Volume Clustering: Tailor your footprint chart for ninjatrader to display Volume Clusters and the Point of Control (POC) for institutional-grade accuracy in identifying key support and resistance.
he ICF Market Advantage: Engineered for Professional Traders
At ICF Trading, we don’t just build indicators; we build institutional workflows. The ICF NinjaTrader Footprint Pro is specifically designed to fill the content and performance gaps left by generic, one-size-fits-all tools found elsewhere on the market.
Zero-Lag Performance: Unlike many other ninjatrader footprint tools that freeze or lag during high-volatility news events, our engine is fully optimized for the NT8 multi-threaded architecture. This ensures stable, real-time data delivery when you need it most.
Visual Clarity: We’ve eliminated “chart fatigue” with a sleek, highly customizable UI. Whether you prefer a dark or light trading setup, the ICF Pro fits perfectly into your environment, allowing for long hours of focused analysis.
Institutional Edge: This tool is the backbone of the ICF Market methodology. It is engineered to bridge the gap between retail price action charting and professional order flow and liquidity analysis.
Using the ICF footprint chart indicator, traders can make more informed, data-driven decisions by visualizing hidden volume dynamics that remain invisible on standard price charts. This transparency allows you to anticipate market moves before they happen:
Anticipate Reversals via Absorption: Identify when large buyers or sellers quietly support a price level, absorbing all incoming orders. This gives you the opportunity to enter a position right before a significant upward or downward bounce.
Spot Dominant Pressure: Identify stacked buy or sell imbalances—multiple price levels in a row where aggressive pressure indicates a high-probability breakout.
Consolidated Intelligence: Instead of juggling a separate volume profile, delta indicator, and manual tape reading, the ICF Pro integrates everything into a single, high-performance view.
Your Personal Trading Assistant: Custom signals act as an assistant, alerting you to unusual order flow events like sudden volume spikes or delta flips, freeing you to focus on execution rather than watching every tick.
The ICF NinjaTrader Footprint Pro stands out as a next-generation order flow tool because it merges precise Level II data with advanced algorithmic detection.
Bid/Ask Execution Perspective: View every contract traded on both sides of the auction to assess real-time pressure at every price level.
POC & Value Areas at a Glance: Instantly locate the Point of Control (POC) and the range where 70% of the volume occurred to find high-conviction support and resistance levels.
Institutional Data Support: Direct feeds from CME and the NYSE provide access to deep market data for monitoring large volume flows.
Advanced Detection Algorithms: Automatically detect imbalances and absorption patterns, with potential zones marked visually and accompanied by alerts.
Specialized Volume Filters: Use the ICF_Volume Filter Detector to set custom thresholds and isolate large institutional “Block Trades” from market noise.
Integrated Professional Suite: Includes the ICF_Volume Journal for historical analysis and the ICF_NEWS overlay to correlate order flow with high-impact economic events.
User-Centric Performance: A fast settings panel allows for on-the-fly adjustments to colors, fonts, and filters without ever reloading the chart.
Expert Backing: Built by an official NinjaTrader partner team with over a decade of experience in NinjaScript development and professional trading.
In summary, ICF NinjaTrader Footprint Chart Pro brings institutional-level insight directly to your trading platform. By merging volume profile, delta analysis, and customizable signals, it provides a 360° view of market activity in one glance.
Equip yourself with the power of transparent order flow analysis. With ICF Market’s Footprint Chart Pro, you stay a step ahead of the competition, making more confident decisions by seeing the real activity behind every price movement.
Conventional candlestick charts only show open, close, high and low. Footprint Pro displays volume traded at each price split by buyers and sellers, telling you who is behind a move.
Yes. To fully utilize Footprint Pro you need Level II and delta data provided by regulated data vendors such as the CME. ICF Market offers data packages tailored to your needs.
After purchase, you’ll receive the installer and a PDF guide. In NinjaTrader 8 go to Tools > Import, import the indicator and then add ICF Footprint Pro from the Indicators panel. Our support team can help you through the process if needed.
Absolutely. ICF Market Footprint Pro Chart has its own settings window that lets you adjust colors, fonts, filters and alerts without reloading the chart.
The trial version offers limited features for a set time (e.g., 14 days), while the full version unlocks all tools—such as Volume Journal and volume filters—and provides lifetime updates.
For smooth performance, we recommend at least a Core i5 processor and 8 GB of RAM. Thanks to optimized code and tick aggregation, you can still achieve good performance on mid-range systems. However, if you want to use certain features of the ICF Footprint Chart tool that require the Tick Replay option, we recommend a system with 16 GB of RAM.
Yes. Footprint Pro is designed to work seamlessly with other ICF tools including ICF_WAP, Volume Profile and Order Book; you can combine them on a single chart.
After purchase your ICF Market account will be activated and all updates will be available automatically. Our support team is on hand 24/7 by email or live chat.
Footprint charts are specialized order flow charts that reveal the exact volume traded at each individual price level within every bar. Unlike standard candlesticks that only show price movement, a footprint chart for NinjaTrader displays the internal bid vs. ask volume, showing exactly how many contracts were executed on both the buy and sell sides at every tick.
This transparency provides an unparalleled view of market microstructure, allowing you to see exactly where aggressive buyers or sellers stepped into the auction. By using a footprint chart tool for NinjaTrader 8, you gain a real-time view of supply and demand. High-probability patterns such as buy/sell imbalances, absorption (where large orders halt a price move), and exhaustion become immediately obvious, helping you confirm if a price move is backed by genuine volume or is a low-conviction trap. In fast-moving futures markets, this indicator is invaluable for identifying hidden support and resistance zones and timing entries with surgical precision.
The NinjaTrader Footprint Indicator is engineered to turn complex data into actionable trading intelligence through these core use cases:
Identify Buying and Selling Pressure: Reveal who truly dominates the market by comparing bid and ask volume at each price level to spot hidden trends and potential reversal points.
Discover Hidden Support and Resistance: Use the Point of Control (POC) and Value Area to find the price levels with the highest traded volume. These levels act as institutional anchors and often provide the strongest support or resistance in the market.
Confirm Trend Continuation or Reversal: By combining delta data with imbalances, Footprint Pro helps you decide if market pressure is growing or fading. This insight allows you to accurately gauge the momentum behind any price movement.
Optimize Entries and Exits: Precise control over order flow information improves your trade timing. Identify signs of buyer or seller activity before major breakouts occur, allowing you to adjust your positions accordingly.
Don’t settle for “lagging” indicators that only tell you where the market has been. Join the elite group of traders using the ICF NinjaTrader Footprint Pro to decode the market’s DNA. Whether you are looking for a footprint chart indicator to refine your entries or a complete footprint tool for NinjaTrader to build a brand-new strategy, ICF Market provides the institutional-grade precision you need.
Add to Cart – Experience the Elite Order Flow Difference Today!
A footprint chart is a type of trading chart that shows the volume traded at each price within a bar (candlestick). Instead of just the open-high-low-close, a footprint displays the number of contracts traded on the Bid (sell side) and the Ask (buy side) at every price level. This allows traders to see order flow details, such as where buyers are dominant or sellers are aggressive inside each candle. In practice, footprint charts help you read the market’s intention by exposing the internal buying and selling pressure that regular charts hide.
The “best” tool must combine data accuracy with platform stability. The ICF Footprint Pro is widely considered the elite NT order flow tool because it offers institutional-grade imbalance detection without the CPU lag common in other footprint indicator versions.
Yes. To get the most out of your ninjatrader footprint chart, a high-quality tick-by-tick data feed (like Rithmic, CQG, or IQFeed) is recommended. The ICF Pro indicator is fully compatible with all major NinjaTrader-supported data providers.
While a Volume Profile shows where volume occurred over time, a footprint chart indicator for ninjatrader shows you how that volume was executed (at the bid vs. at the ask). It provides the “micro” view needed for precise entries.
NinjaTrader 8 offers a built-in feature called Order Flow + Volumetric Bars, which is essentially NinjaTrader’s version of a footprint chart. However, it’s only available if you purchase NinjaTrader’s Lifetime license or pay for the Order Flow+ add-on. Many users opt for third-party solutions like ICF Footprint Chart Pro to get more advanced features and flexibility. With ICF’s footprint indicator, you can use NinjaTrader’s free version to access professional footprint charts, avoiding the need for an expensive subscription. Plus, ICF Footprint Pro provides additional capabilities (like custom signals and unlimited customization) that go beyond NinjaTrader’s basic volumetric bars.
A footprint chart tool can significantly enhance your trading by providing real-time market context. It helps you confirm whether a price move is supported by strong volume (e.g. a breakout with lots of buy orders) or is weak and likely to fail. You can spot when big traders are stepping in: for example, a large buy imbalance at a key support level could signal a coming rally. Footprint charts also let you gauge momentum exhaustion – if a price is climbing but the volume at each higher level is dropping, it may indicate buying is drying up. By reading these clues, you can make smarter decisions: enter trades in the direction of genuine order flow strength, set more precise stop losses (just beyond high-volume zones or imbalances), and avoid false breakouts. In short, footprint charts add a layer of confirmation and timing to any strategy, giving you a trading edge.
Absolutely. In fact, most ICF Trading members use the footprint chart tool specifically for scalping and day trading to identify “order flow absorption” before a price reversal occurs.
To fully utilize ICF Footprint Chart Pro (or any footprint indicator), you should have a NinjaTrader 8 data feed that provides Level I and Level II tick data (bid/ask data for each trade). This is typically available with most futures brokers or data providers when you enable real-time and historical tick data. In NinjaTrader, it’s recommended to run the chart with Tick Replay enabled so that historical footprints can be constructed accurately from tick data. ICF Footprint Pro is optimized for NinjaTrader, but for best performance use a modern computer with sufficient RAM and processing power, especially if you’re loading very high-frequency tick charts. The indicator has built-in filters and an “auto scale” so you can adjust how much data to process (for example, limiting the number of days or ticks loaded) to keep things running smoothly. With the proper data and a reasonable configuration, you’ll get a seamless footprint chart experience.
Yes – while ICF Footprint Chart Pro is a professional-grade tool, it’s designed to be approachable for all traders. If you’re new to footprint charts, the indicator comes with sensible default settings and an intuitive interface, so you can start with basic bid/ask footprints and gradually explore more advanced features (like imbalances and delta) as you become comfortable. The customization menu is clearly organized, making it easy to toggle things on/off or change colors without breaking anything. ICF also provides documentation and support to help users understand the various functions. For beginners, a footprint chart can seem complex at first, but it’s one of the best ways to learn how the market really works. By using this tool, new traders quickly gain insights into price action (for example, learning to spot when big buyers support a level). Overall, ICF Footprint Pro can accelerate a beginner’s learning curve in order flow trading, while also offering the depth and sophistication that experienced traders demand.
Absolutely. ICF Footprint Pro is highly customizable, which means you can tailor the display to fit your trading style or strategy. If you prefer a clean look, you might show just the delta per bar or only highlight the largest imbalance in each candle. If you’re an order flow power-user, you can turn on everything from detailed bid/ask numbers to multiple filtered signals. You control colors for buy and sell text, background shading for volume intensity, which additional metrics to display (like POC, total volume, number of trades), and much more. You can even save different templates or “modes” – for example, one mode for scalping with very fine detail and another for higher-timeframe analysis with simplified view. The goal is to make the footprint chart your own, so it emphasizes the information you find most valuable. ICF Footprint Chart Pro gives you that freedom, ensuring the tool adapts to you (not the other way around).
The ICF Pro distinguishes itself through its 4-Mode architecture and granular Signal Engine. While other tools simply show volume, we allow you to filter for ATS (Average Trade Size) and AVB, giving you a direct look at institutional “Big Hands” activity.
Yes. Our footprint chart for NinjaTrader includes a dedicated “Unfinished” toggle that highlights price levels where the auction failed to complete at the high or low, signaling a high-probability return to that price.
Absolutely. The Absorption Area V Filter and Bar Count settings allow you to isolate price levels where aggressive orders were absorbed by passive limit orders—a classic sign of a market reversal.
Yes. For the highest accuracy in your ninjatrader footprint chart, the indicator is optimized to work with NinjaTrader’s “Tick Replay” feature, ensuring historical imbalances are calculated with 100% precision.
Most footprint indicator options on the market force you into a rigid, “one-size-fits-all” view. ICF NinjaTrader Footprint Pro is built to adapt entirely to your personal workflow. Whether you are hunting for micro-scalps in the NQ or analyzing institutional absorption in Gold (GC), our tool provides deep market microstructure visibility that standard indicators simply cannot match.
We don’t just display raw volume; we calculate the Intent behind every order using our advanced signal logic engine. Developed by ICF Market with a dedicated focus on professional-grade analysis, this tool unlocks visibility into every tick of the market. It has been redesigned and enhanced far beyond typical footprint chart indicators, packing in elite features while remaining highly user-friendly.
With this single NinjaTrader footprint indicator, you can replace multiple separate tools; it combines volume profile insight, delta analysis, and custom signals into one seamless package. The result is the ability to trade with the confidence of an institutional professional, but at a fraction of the cost of high-end specialized platforms.
The ICF NinjaTrader Footprint Pro is engineered as the backbone of the ICF Trading ecosystem, bridging the gap between retail charting and professional liquidity analysis.
Zero-Lag Performance: Built specifically for the NT8 multi-threaded architecture, ensuring smooth updates and zero-lag performance even during high-volatility news events.
Auto-Font Scaling: Provides perfect readability and automated scaling for 4K or ultra-wide monitors.
Integrated Statistic Grid: Displays vital metrics like Cumulative Delta, Session Volume, and Delta Percentage directly on your footprint chart tool for a 360-degree view of market sentiment .
Customizable Alerts: Get notified instantly via the internal messaging system or email when specific Absorption or Imbalance criteria are met.
Specialized Branding & Authority: ICF Market has spent over five years exclusively developing order flow tools for NinjaTrader. We are an official NinjaTrader partner and a trusted CME data provider.
Trader-Developer Expertise: Our team blends the experience of active professional traders with the technical skill of NinjaScript developers to deliver a precise and comprehensive product.
Complete Professional Suite: Beyond the footprint, our suite includes specialized tools like ICF_WAP (advanced VWAP), ICF_Order Book, and the Professional Volume Profile, all designed to work together seamlessly.
ICF NinjaTrader Footprint Pro is the next generation of order-flow intelligence for NinjaTrader 8 and later versions. By leveraging precise Level II data and combining bid and ask orders, this add-on projects deep market structure directly onto your chart.
Unlike traditional charts that only show open, close, high, and low prices, Footprint Pro reveals exactly how much volume traded at every price, whether buyers or sellers executed those trades, and how the Point of Control (POC) and Value Areas are formed. This information allows elite traders to analyze the market tick-by-tick and make the most informed decisions possible.
ICF NinjaTrader Footprint Pro puts the power of institutional market analysis directly in your hands. By accurately displaying bid and ask orders, identifying imbalances, and mapping value areas, this indicator helps you trade faster, more accurately, and more profitably.
Free Advanced Order Flow Training Course: When you invest in ICF Market’s revolutionary volume indicators, you receive access to our Advanced Volume Trading and Order Flow courses completely free. These courses teach you exactly how to master these tools and benefit from the years of experience held by our professional mentors.
“Best choices on products from ICF Market users!”


